Year 9A & Year 9B
Today you are going to mark some work and answer an essay question.
Follow the instructions step by step:
1.
Task 4 on p.48-49.
2.

Mark the calendar timeline on p.23.
3.
The matching task on p.27.
4.
The diagram on p.28.
5.
The steps diagram on p.30.
6.
To test your knowledge and understanding, finish the Questions on page p.33 in your Workbook.
“Life in Nazi Germany, p.33”
7.

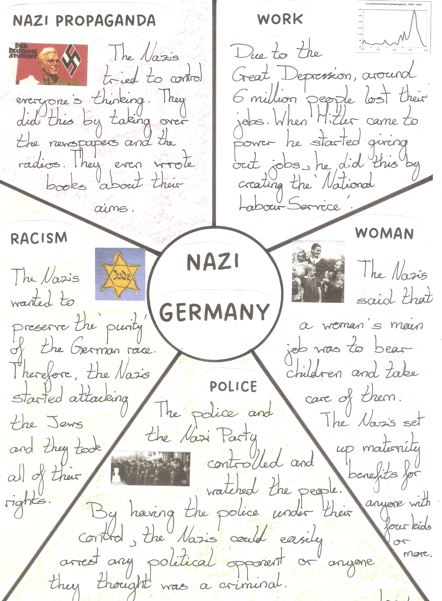
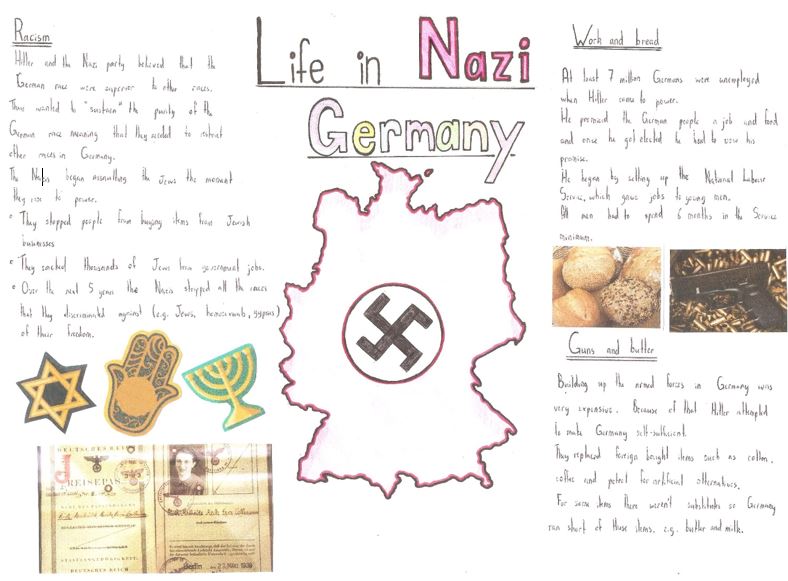
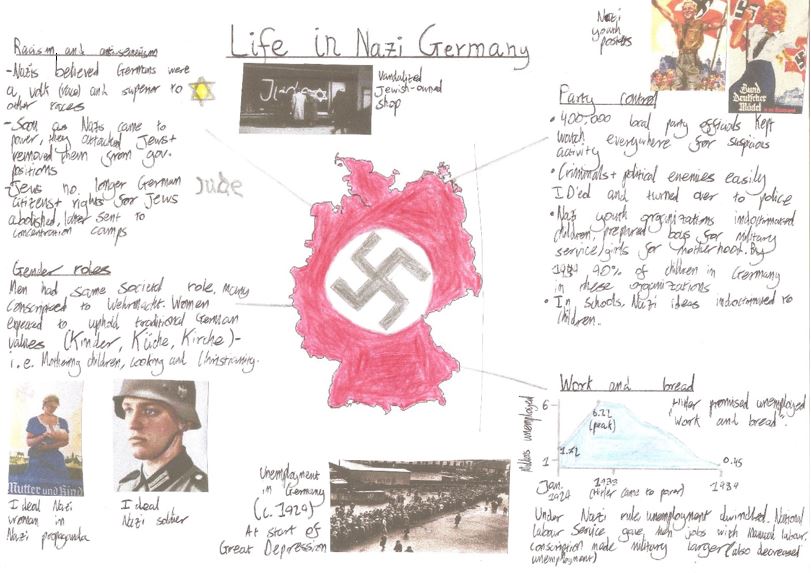
Continue with the making of an infographic on Life in Nazi Germany.
(Use the information in your workbook and a blank A4 page for this task.)
What is an infographic?
It is a visual representation of information or data, using:
- charts
- diagrams
- pictures
- interesting facts
- short paragraphs
- short sentences
Examples of infographics on “Life in Nazi Germany”:


(WordPress advertisements may appear below.)
